Technical analysts predict Ethereum price surge
Ethereum (ETH) is in a weird place at the moment. While it is the second largest cryptocurrency in the world by market cap, it has underperformed its main rival, Bitcoin (BTC), over the course of the current bull run, by a pretty significant margin.
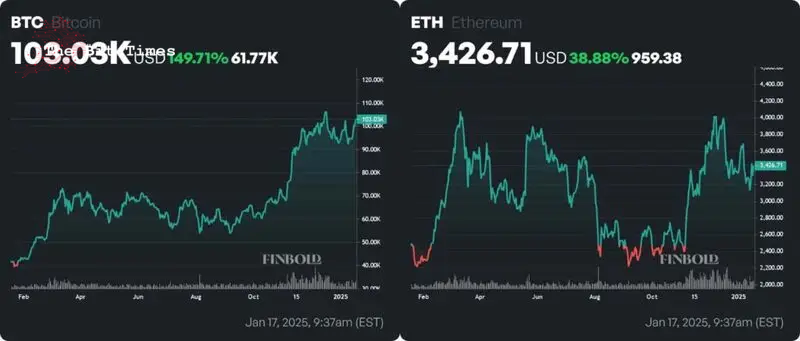
Compared to prices this time last year, the price of Bitcoin increased by 149.71% — in contrast, ETH has seen a much smaller 38.88% surge in the same timeframe.
Since the beginning of the year, BTC has surged by 7.95% — while Ethereum has rallied by a meager 0.22%.
Picks for you
At press time, ETH was changing hands at a price of $3,426.

In addition, investors are increasingly turning to altcoins and even meme coins — on account of the impressive returns these two types of digital assets have provided. All in all, Ethereum doesn’t seem to inspire much confidence at the moment.
However, as dire as the circumstances might appear at first glance, some analysts believe that this merely means that ETH is undervalued. Over the past couple of days, two noted crypto researchers have turned to technical Analysis — and their findings suggest that Ethereum might be preparing for a significant move to the upside.
Prominent on-chain analysts believe Ethereum could double or almost triple in price
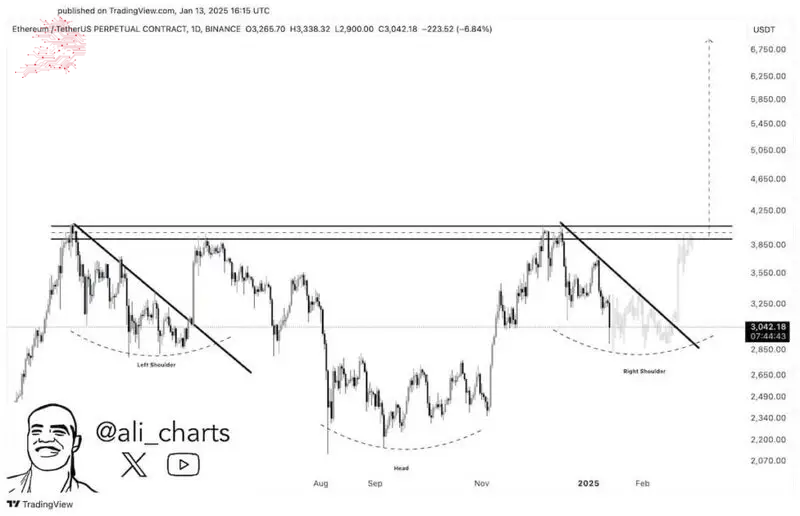
Renowned cryptocurrency technical analyst Ali Martinez took to social media platform X — sharing a chart depicting an inverse head and shoulders pattern in a January 17 post. The inverse head and shoulders is a bullish reversal pattern — in simple terms, it signals the end of a downtrend.

In the case of this pattern, resistance is plotted using the two ‘shoulders’, which represent a price point of approximately $4,000 in this instance. With a head and shoulder pattern, the distance between resistance and the lowest point of the ‘head’ is added to that level to provide a price target. Per Matinez’’s chart, the price of Ethereum could surge to as high as $6,750 — a mark equating to a 97.02% upside.
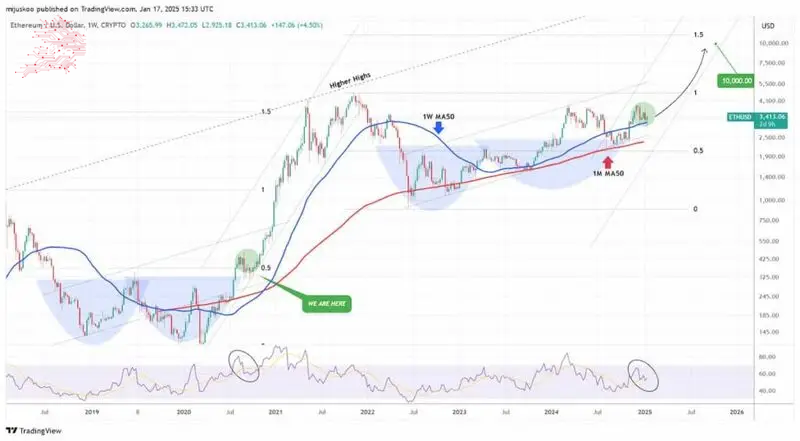
Martinez isn’t the only technical analyst bullish on ETH — pseudonymous crypto researcher TradingShot set an even more ambitious $10,000 price target in a TradingView post published on January 17.

The analyst believes that we are in the last consolidation period before this cycle’s parabolic ETH rally begins. Going forward, he believes that the 50-week moving average, plotted as the red line in the chart above, will continue to act as a support level.
As bullish as both of these cases are, readers should note that technical Analysis, on its own, doesn’t provide a holistic view of future prospects — while indeed possible, neither Martinez’s nor TradingShot’s conclusions are guaranteed to come to fruition.
Featured image via Shutterstock
Comments
Post a Comment